Sensor Data: A Gold Mine or a Minefield?
The value of sensor data lies with how well you extrapolate the data into actionable items.
Internet of Things technology provides an inordinate amount of data. We have access to sensor data as well as static system data and settings. The data tells us the case temperatures, the setpoints, the defrost cycles, door status, and discharge pressure. We can see relative humidity, ambient temperatures, oil pressure, and many other performance indicators. We receive data on CO2 levels, receiver levels, acorn vac, device communications along with user access data.
The value lies with extrapolating the data into useful diagnostic findings. If you are trying to figure out what some of the common alarm scenarios really mean and how to use the data to further investigate the root cause, keep reading. This article walks you through some basic data interpretations and underlying root causes for alarms.
Refrigeration High Case Temp Alarms
High Case temperature alarms raise the red flags quicker than most other alarms. We all know that if the case temp exceeds safe levels it means potential product loss which can thousands of dollars in lost product.
Some of the reasons we might see a high case temp alarm include:
- Fans not operating.
- Case door left open.
- Defrost schedule coincides with stocking times.
- The valve stops feeding the case.
- An iced-up case.
- Unit low on Refrigerant.
- Improper placement of temperature probes.
- Mechanical System (compressor or rack) is down.
So how do you know which direction to start looking to determine the issue at hand? We highly recommend working with an energy management service provider to analyze the data to help better direct service work orders and maintenance. R3 Retail Development offers an EMS Alarm Triage program and a standard energy management services contract. But, as a facility manager, it is still good to know the basic troubleshooting steps to get the most out of your building controls system. In this instance, the first action we would take is pulling temperature graphs for the past week and reviewing any alarm data to discern patterns of performance (even notices and alarms that returned to normal).
Elevated temperatures & Defrost Cycles
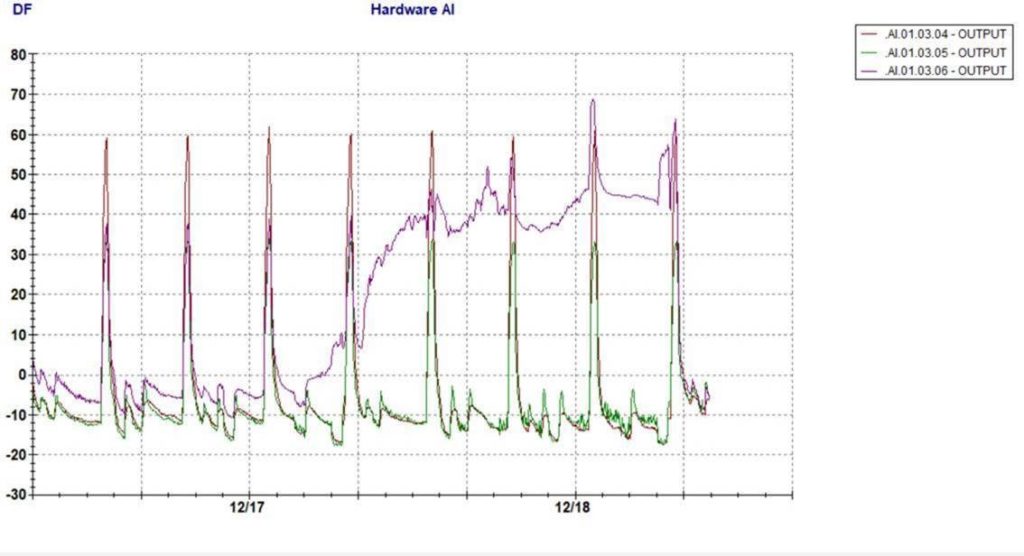
On the temperature graph, a best practice is to graph the defrost cycles along with the unit temperatures, this will give an idea if the elevated temperatures correlate in any way to the defrost timing. If your temperature has a curve prior to the defrost spike, this is typically indicative of an iced-up case.
In Figure 1, the graph shows a curve prior to the spike (which indicates the defrost cycle). From this graph, it appears that the unit is iced and the defrost is unable to remove the ice. We can also measure the amount of time the case is outside of the established set-point range, or how long does it take for the case to return to an acceptable temperature level.
To troubleshoot this, we can remotely run an additional defrost cycle to see if that helps clear the ice. If not, we would then recommend dispatching a refrigeration tech to do a manual defrost.
Walk-In Units
In walk-in freezer units, common causes for elevated temperature alarms include prolonged periods with the freezer door left open for stocking, fans turned off at the switch or improper placement of the temperature probes.
One of the issues we review is how the defrost times correlate to stocking hours. It has been our experience that stores with a higher volume of sales and more frequent stocking may need to have a different profile established to avoid defrosts during times where stocking frequently occurs.
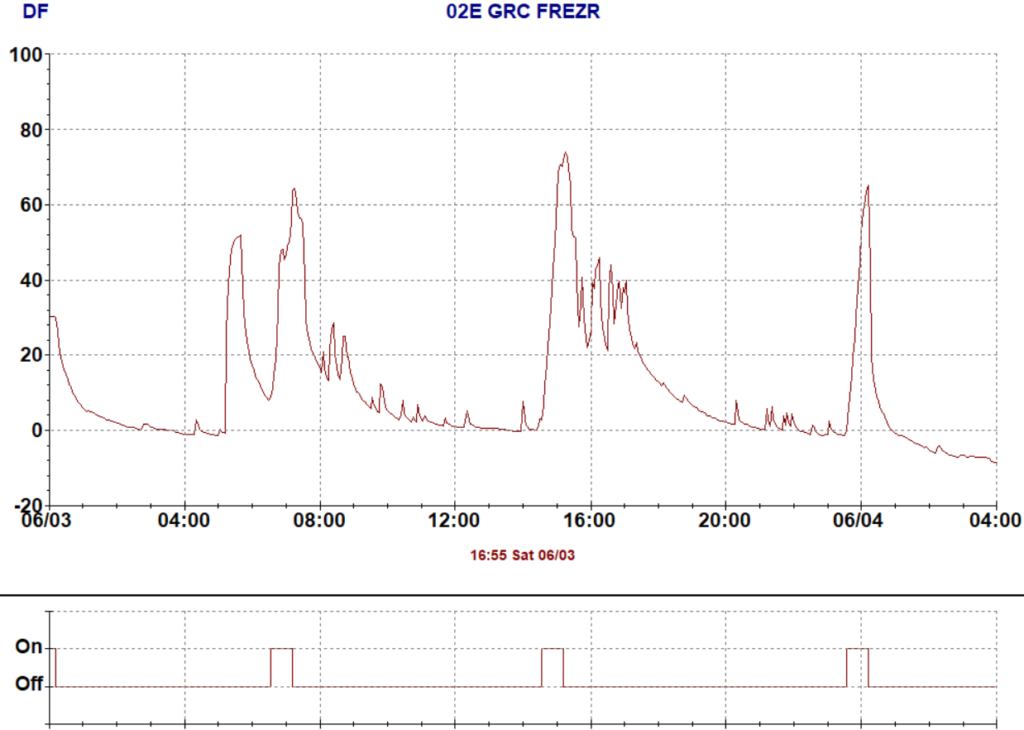
Figure 2 shows a graph where the door is open for stocking immediately before or after a defrost, this does not allow the unit to fully return to the established set point after defrosting, which results in a high-temperature alarm.
If the defrosts do not coincide with the door being open, nor look like an issue of icing, the next thing we check is to see if the fan is running. This is a notable example of how arming your employees with system knowledge can help alleviate issues. It is quite common for the person doing the stocking to turn off the fan so that they are more comfortable while loading the case. Without understanding how the fan acts in overall unit performance, turning the fan off may seem to be an innocent thing, but if it is off for a prolonged time or if the employee forgets to turn it back on, it can end up as a costly mistake.
Deceitful Data?
There are other scenarios where the alarm notification is not necessarily indicative of the issue at hand. We recently received a call saying the heat had been running for a week, but the inside temperature was still cold. There is a sensor on supply air that indicates the heat is on. After verifying the heat was on, and there were no other HVAC system alarms, we looked for cause and effect from other sensors. This building employs a demand control ventilation strategy which measures air quality levels. The sensors measure CO2 levels within the building space.
When the CO2 level is higher than established guidelines, the controller sends a signal to adjust the damper position for increased fresh air volume. In this instance one CO2 sensor was reading elevated values, resulting in the dampers being completely open. This prevented the heating system from being able to reach and maintain the setpoint. A second CO2 sensor was reading within the normal range. If the CO2 levels were significantly elevated, both sensors should have similar readings. 
From this information, we deduced the root cause of this issue to be a faulty CO2 sensor and completely unrelated to the heating system. This small repair resulted in significant energy savings, as the heating system did not continue to work overtime to maintain comfort levels.
Humidity Sensors
For geographical areas with high humidity levels, a dehumidification strategy is standard. Sensors that read humidity levels within the building space are the main components for successful dehumidification. When the sensors read higher humidity levels that signal the HVAC unit to start dehumidifying.
Most building controllers with dehumidification sensors send alarm notifications when the humidity level exceeds the established range. Recently we addressed an alarm for a high humidity reading at a Florida location. Upon receiving the alarm notification we reviewed the relative humidity (RH) graph. The graph showed a daily increase in RH for 4 days prior to reaching the alarm threshold. A review of the space temperatures during this time showed temperatures within an acceptable range. At this point using the space temperature and RH values, we calculated the dew point. The dew point was significantly higher than the acceptable range for this location.
Sensor Troubleshooting
To further pinpoint the issue we verified the digital output control signal to the HVAC unit which initiates the dehumidification process. Barring a control signal issue, we deduced the problem lied with the HVAC unit.
This building uses Dx cooling to remove moisture from the air, so we concentrated our efforts on reviewing its performance by analyzing the pressure and temperature data. Upon review of the supply air temperature during dehumidification, we found that the unit was not providing adequate cooling. The next step was to review the compressor operating suction pressure to identify the reason for the lack of cooling. We found that the suction pressure dropped significantly, which was short cycling the compressor on low-pressure control. Based on experience, we knew this typically happens when the refrigeration circuit is low on refrigerant charge.
We recommended dispatching a technician to investigate the refrigerant charge and they found that there was a leak and the system was significantly low on refrigerant. This was an easy repair and proper system functioning brought the space back into an acceptable humidity range within 24 hours.
Sensor data can be a gold mine or a minefield, depending on how you extrapolate meaning and determine actionable items. On point business rules for monitoring sensor data are essential. Likewise, to get the most out of your building controls investment we recommend a periodic data review to identify opportunities for performance improvement, energy-saving strategies, and reduction in maintenance costs.